The nPoint LC.400 series of controllers have several internal functions for use with raster scanning. A traditional raster scan can be generated via the simple Raster Scanning GUI used in the traditional raster scan below. Additional raster scanning patterns can be generated via the arbitrary scan capability of the controller. This provides complete flexibility for the type of scanning pattern, leading to decreased time to complete a scan.
The LC.400 controllers can also record up to 8 streams of internal data simultaneously, including voltage measurement from the BNC analog inputs. In this case, the analog inputs can be disabled for position command functionality while retaining recording capability. This is useful in applications that benefit from correlating stage sensor readings with measurements such as fiber alignment intensity. The internal recording function can sample every 24 microseconds. The rate can be adjusted to record for longer periods of time for a given buffer size. Sensor and BNC analog input values are recorded with 20 bit resolution.
In the following sections, the NPXY60Z20-257 stage has been used to demonstrate the various raster scanning modes.
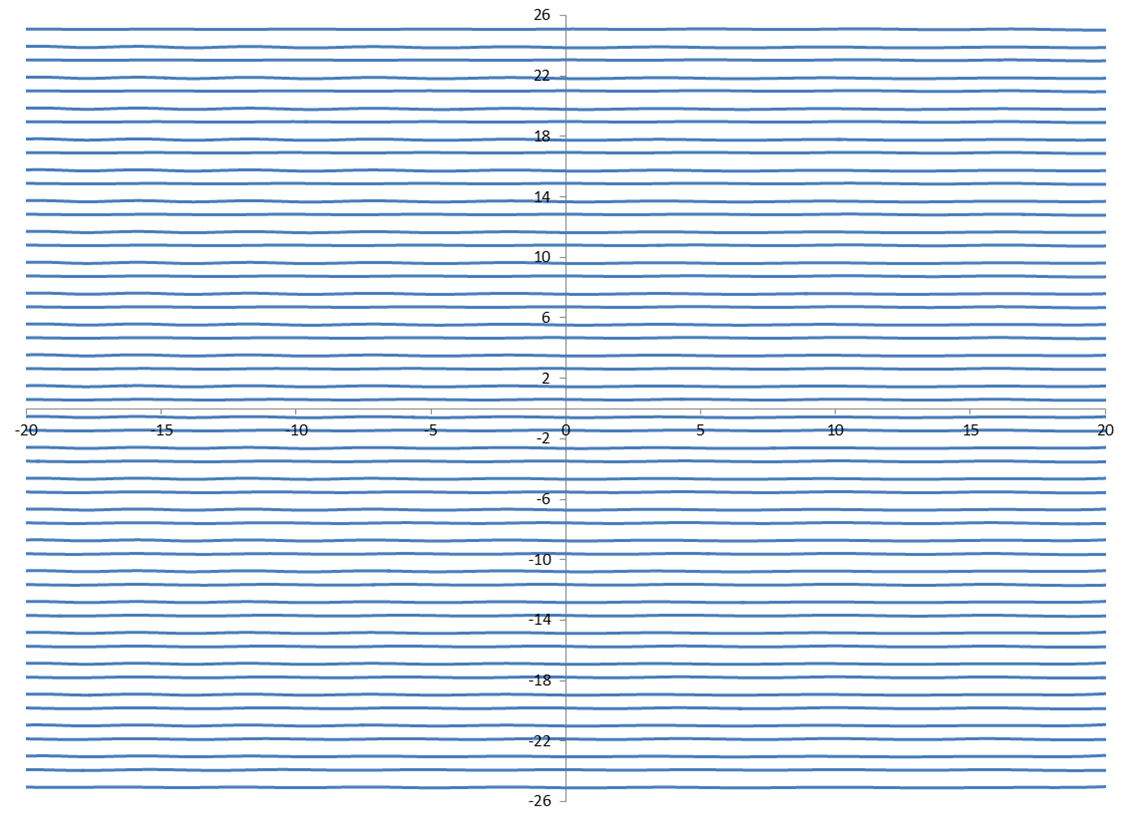
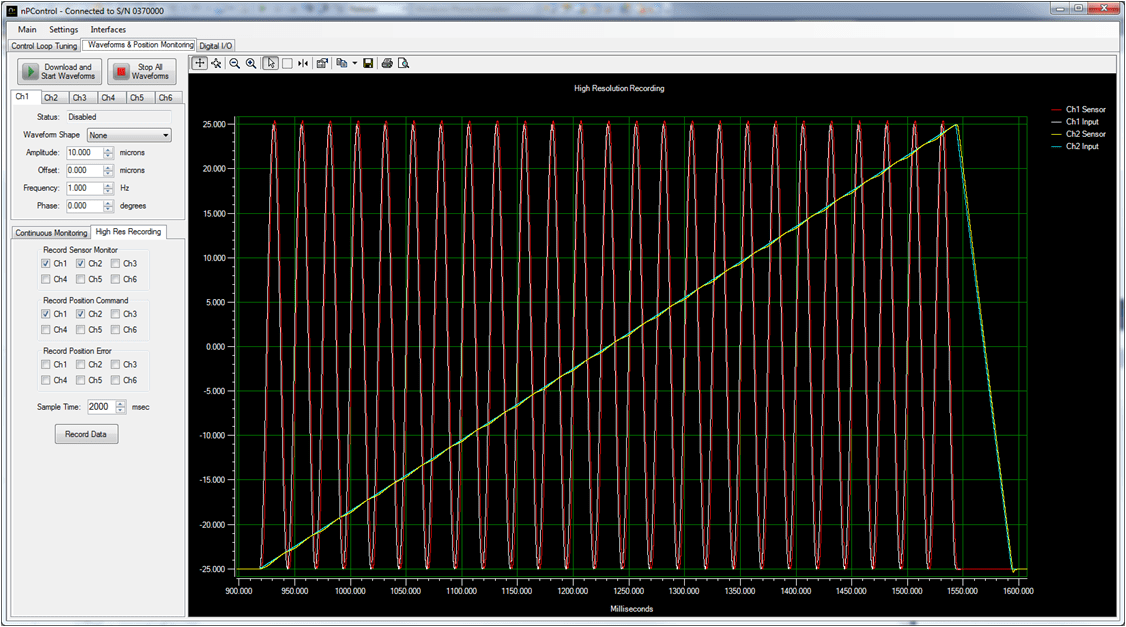
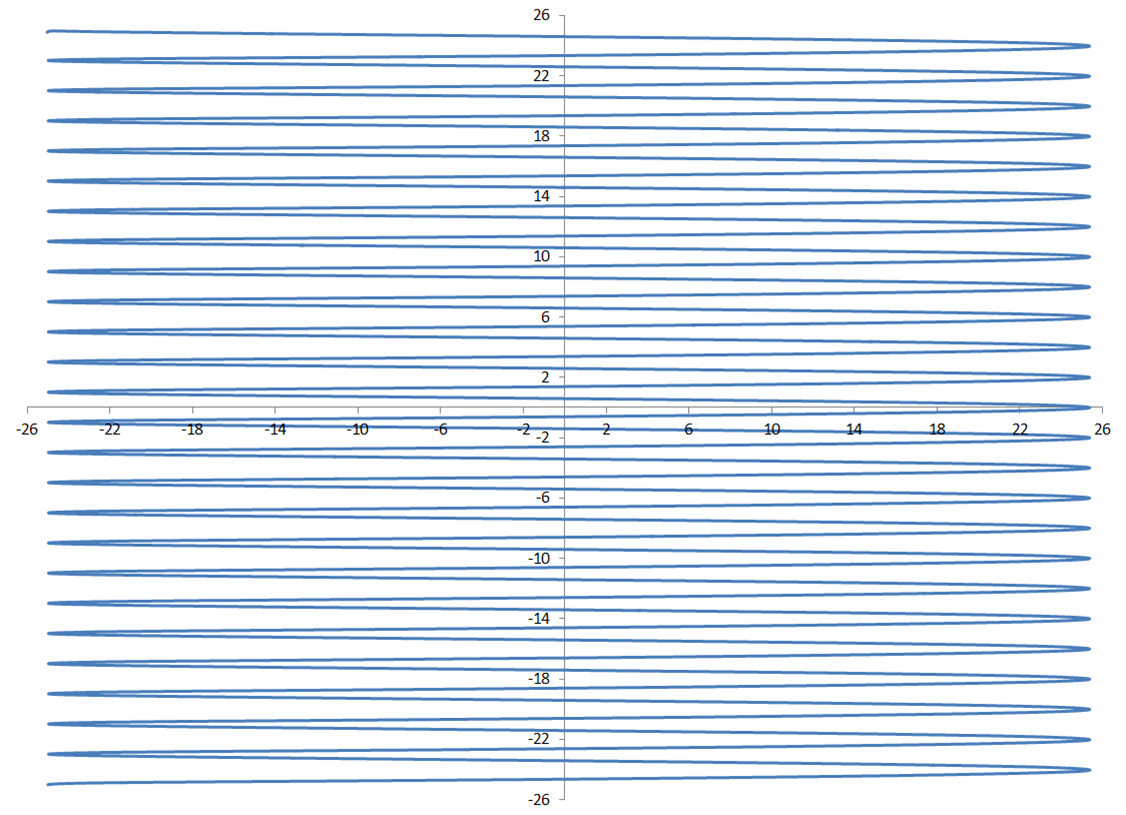
Traditional Raster Scan
Constant velocity motion in the fast axis and stepping in the slow axis.
Pros
- Simple pattern to synchronize with external data acquisition
- Constructing an image from the sampled data is the easiest
Cons
- High frequency motion profile content and acceleration may disturb the overall mechanical assembly, causing noisy data acquisition.
- Data at the edges of the fast axis may need to be discarded due to tracking error when motion changes direction
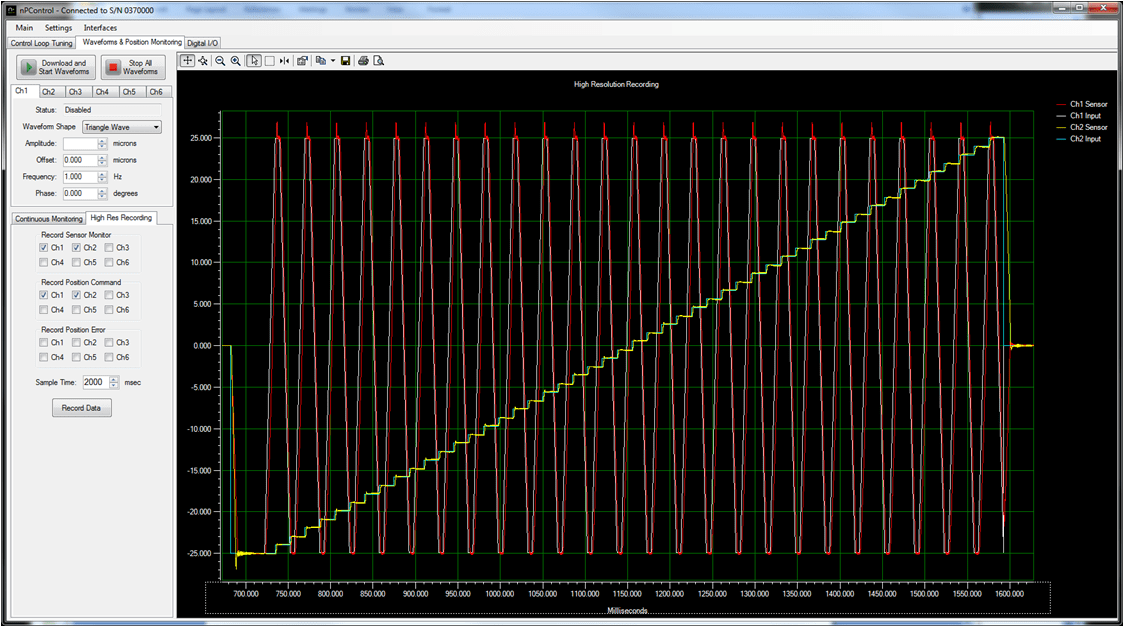
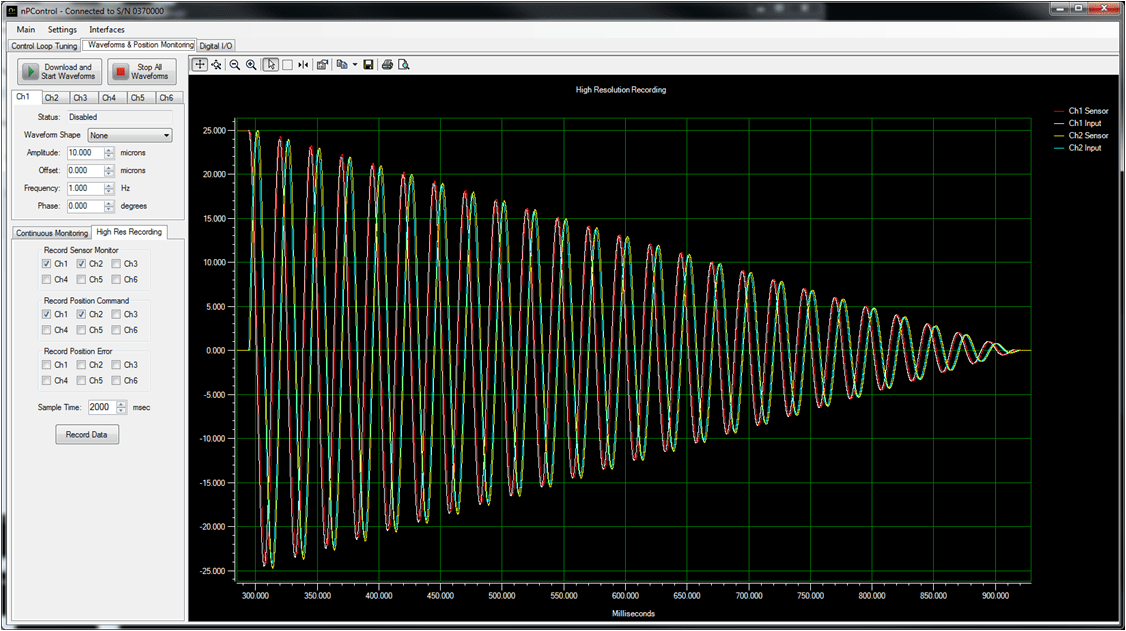
Raster Scan with Constant Velocity Ramp
Sine wave is used in the fast axis and single constant velocity ramp for the slow axis.
Pros
- Smooth motion profile reduces mechanical disturbance to avoid noisy data acquisition
- The full data set can be used without discarding data when motion changes direction
Cons
- Line spacing at the edges of the fast axis is two times the line spacing at the center
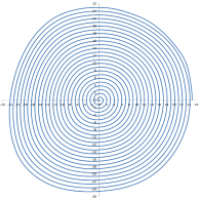
Spiral Scan
Pros
- Very smooth motion
- Constant line spacing
Cons
- Scan covers less area for a given fast axis frequency and amplitude
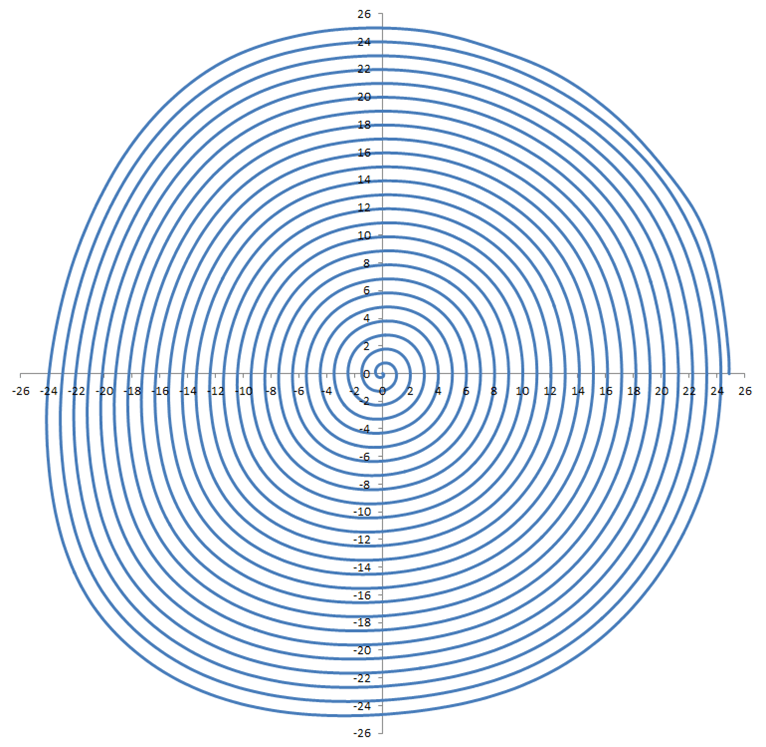
With the same piezo stage and greater 200mA current option the system can scan at 80Hz covering a 50 micron diameter area in less than 350 milliseconds. This is the fastest scan achieved with this system under the conditions tested.
More details and scan parameters can be found in the following PDF: Scanning For Photonics Applications